How To Use Machine Learning To Predict Customer Churn
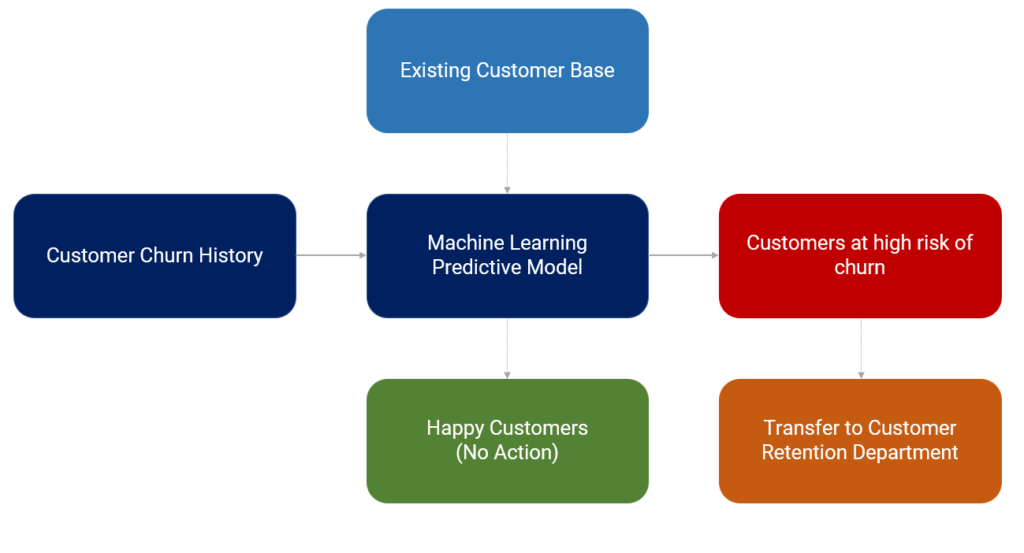
Imagine being able to accurately predict when a customer is likely to leave your business, allowing you to take proactive measures to retain them. With the power of machine learning, this is now possible. In this article, you will discover how to effectively utilize machine learning algorithms to predict customer churn. By identifying patterns and analyzing data, you can gain valuable insights into customer behavior that will enable you to take corrective actions and ensure long-term customer loyalty. Say goodbye to losing valuable customers and hello to a thriving, successful business. Let’s delve into the world of machine learning and its incredible potential for predicting customer churn.
Understanding Customer Churn
Definition of Customer Churn
Customer churn refers to the phenomenon where customers stop doing business with a company. It can be seen as the opposite of customer retention. When a customer churns, it means they have discontinued using the products or services offered by a business. Customer churn is a critical metric for businesses as it directly impacts their revenue and profitability. Understanding and predicting customer churn is crucial for companies to take proactive measures to retain their customers and prevent revenue loss.
Impact of Customer Churn on Businesses
Customer churn can have a significant impact on the profitability and success of a business. When customers churn, it not only leads to a loss of revenue from their direct purchases but also affects the company’s reputation and customer loyalty. The cost of acquiring new customers is typically higher than retaining existing ones, making customer churn an expensive problem for businesses. Additionally, high customer churn rates can indicate underlying issues with products, services, or customer satisfaction, which need to be addressed promptly to prevent further customer attrition.
Why Machine Learning is Used to Predict Customer Churn
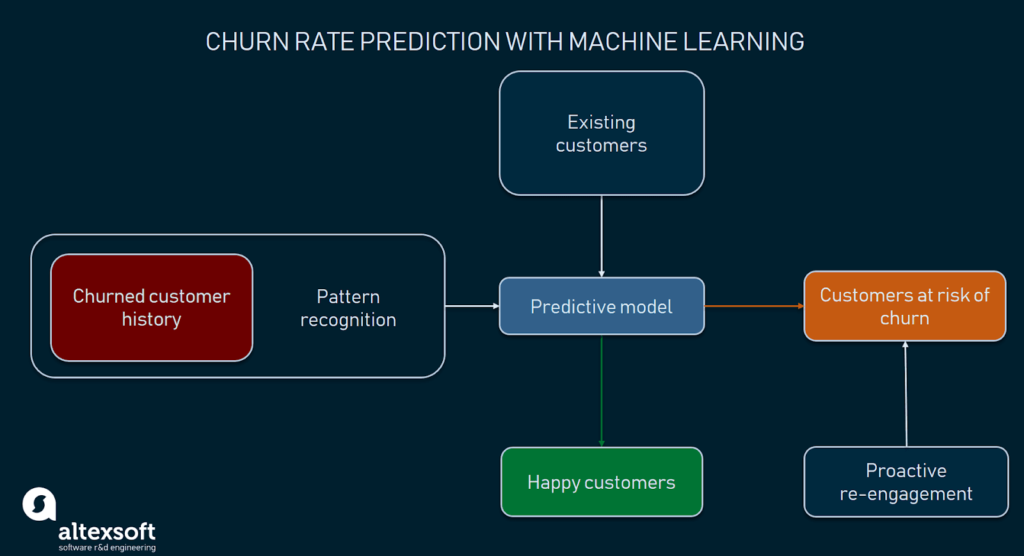
Machine learning has emerged as a powerful tool for predicting customer churn due to its ability to analyze large sets of historical data and uncover patterns and trends. By applying machine learning algorithms to customer data, businesses can leverage predictive analytics to identify customers who are at higher risk of churning. Machine learning algorithms can analyze various customer attributes, such as purchase history, interaction patterns, demographic information, and sentiment analysis from social media, to build models that can predict and anticipate customer churn. These models can then be used to take proactive measures to retain customers, improve customer satisfaction, and boost overall business performance.
Data Collection and Preparation
Identifying Relevant Data Sources
To predict customer churn accurately, it is essential to identify and collect relevant data sources. These sources may include customer demographic data, purchase history, customer interactions, service usage logs, online browsing behavior, and feedback or reviews. Some common data sources for customer churn prediction include customer relationship management (CRM) systems, transaction databases, customer service logs, call center records, and social media platforms. It is crucial to gather a diverse range of data sources to capture a comprehensive view of customer behavior and identify potential churn indicators.
Data Cleaning and Preprocessing
Once the relevant data sources have been identified, the next step is to clean and preprocess the data. This involves removing any duplicate or irrelevant data, handling missing values, and ensuring data consistency. Data cleaning also includes standardizing data formats, scaling numerical features, and encoding categorical variables. Preprocessing techniques such as normalization, feature scaling, and outlier handling are applied to ensure the data is in a suitable format for machine learning algorithms.
Feature Engineering
Feature engineering plays a vital role in customer churn prediction as it involves creating new features or transforming existing ones to improve the performance of machine learning models. This process requires expert domain knowledge and an understanding of the underlying factors that contribute to churn. Feature engineering techniques may include creating customer-specific variables such as customer lifetime value, average transaction value, frequency of interactions, and sentiment analysis scores. By engineering relevant features, the predictive power of the model can be enhanced, leading to more accurate churn predictions.
Data Splitting into Training and Testing Sets
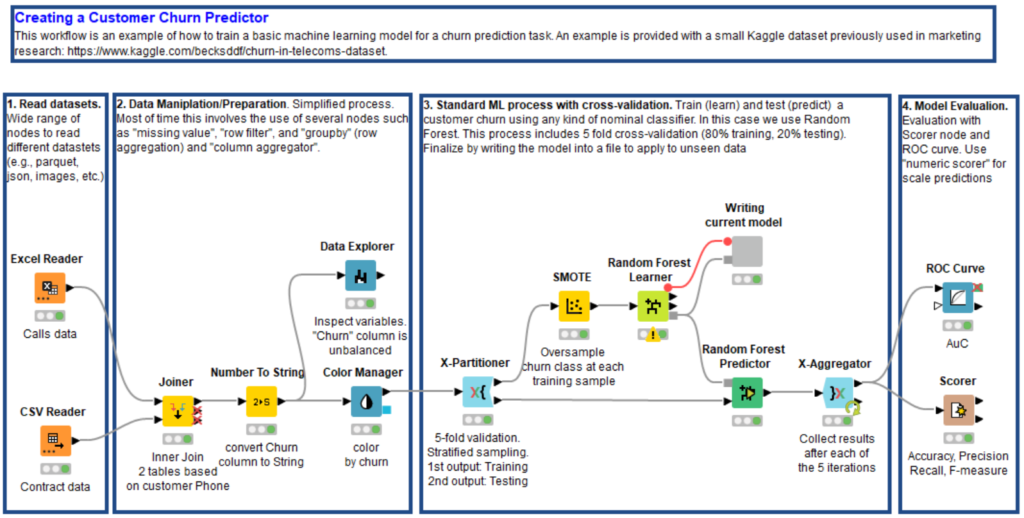
To evaluate the performance of the churn prediction model, it is essential to split the data into training and testing sets. The training set is used to build and train the machine learning model, while the testing set is used to assess the model’s performance and generalization capabilities. It is crucial to ensure that the data splitting process preserves the distribution of churned and retained customers to avoid any biases. Common techniques for data splitting include random splitting, stratified splitting, and time-based splitting, depending on the availability and characteristics of the data.
Choosing the Right Machine Learning Algorithm
Classification Algorithms for Churn Prediction
In churn prediction, machine learning algorithms are typically used for classification tasks, where customers are classified as either churning or non-churning based on their characteristics. Various classification algorithms can be employed, including logistic regression, decision trees, random forests, support vector machines, and neural networks. Each algorithm has its strengths and limitations, and the choice of algorithm depends on factors such as the size and complexity of the dataset, interpretability requirements, and computational resources available.
Comparison of Different Algorithms
When selecting a machine learning algorithm for churn prediction, it is essential to compare and evaluate the performance of different algorithms. This can be done by using performance metrics such as accuracy, precision, recall, F1-score, and area under the receiver operating characteristic (ROC) curve. Comparative analysis helps identify the algorithm that performs the best on the specific churn prediction problem and dataset.
Consideration of Model Complexity
Model complexity refers to the level of intricacy in the machine learning model. It is crucial to strike the right balance between model complexity and model performance. Overly complex models may lead to overfitting, where the model fits the training data too closely but fails to generalize well to new, unseen data. On the other hand, overly simplistic models may suffer from underfitting and fail to capture the underlying patterns in the data. Model complexity should be chosen carefully based on the dataset size, number of features, and available computational resources.
Handling Imbalanced Data
Imbalanced data is a common challenge in churn prediction, where the number of churned customers is significantly lower than the number of retained customers. This imbalance poses a problem for machine learning algorithms, as they tend to prioritize the majority class and struggle to predict the minority class accurately. Strategies to address imbalanced data include oversampling the minority class, undersampling the majority class, or using ensemble methods such as boosting or bagging. These techniques aim to balance the class distribution and improve the model’s ability to predict customer churn accurately.
Feature Selection and Importance
Identifying Relevant Features
Feature selection is the process of identifying the most relevant features from the available dataset. Not all features contribute equally to predicting customer churn, and some features may even introduce noise or redundancy. feature selection techniques such as univariate selection, recursive feature elimination, and feature importance analysis can help identify the most informative features. By selecting the most relevant features, the model’s accuracy can be improved, and unnecessary computational overhead can be reduced.
Exploring Feature Importance Techniques
Feature importance analysis is a powerful technique to identify which features have the most significant impact on predicting customer churn. This analysis helps businesses understand the key factors that influence customer attrition and prioritize their efforts to address those factors. Feature importance can be computed using various methods such as information gain, Gini index, permutation importance, or coefficient values in linear models. By understanding feature importance, businesses can focus on improving the critical factors that contribute to customer churn.
Dimensionality Reduction Methods
In cases where the dataset has a large number of features, dimensionality reduction techniques can be employed to reduce the complexity of the problem. Dimensionality reduction can be achieved through methods such as principal component analysis (PCA), linear discriminant analysis (LDA), or autoencoders. These techniques help capture the essential information in a lower-dimensional space, reducing computational overhead and improving the model’s ability to generalize.

Training and Evaluating the Churn Prediction Model
Splitting the Data into Training and Validation Sets
After preprocessing the data and selecting the appropriate features, it is necessary to split the data into training and validation sets. The training set is used to train the machine learning model, while the validation set is used to assess the model’s performance on unseen data. The data splitting process ensures that the model’s performance is not over-optimized for the training data and provides a more realistic estimate of its generalization capabilities.
Training the Machine Learning Model
Training the machine learning model involves feeding the training data into the chosen algorithm and optimizing its parameters to minimize the prediction error. This process is iterative, and the model is trained by adjusting its weights or coefficients using techniques such as gradient descent or maximum likelihood estimation. The goal is to create a model that can accurately predict customer churn based on the available features.
Performance Evaluation Metrics for Churn Prediction
To evaluate the performance of the churn prediction model, various metrics can be used. These metrics include accuracy, precision, recall, F1-score, area under the ROC curve, and lift. Each metric provides a different perspective on the model’s performance, such as overall accuracy, ability to detect churned customers, or ability to avoid false positives. The choice of evaluation metrics depends on the business’s objectives and priorities.
Fine-tuning the Model Parameters
Fine-tuning the model parameters is an essential step in improving the model’s performance. By adjusting parameters such as learning rate, regularization strength, or tree depth, the model’s ability to generalize can be enhanced. This process is typically done using techniques such as cross-validation or grid search, where different combinations of parameter values are tested, and the best-performing configuration is selected.
Handling Imbalanced Data
Understanding Imbalanced Data Problem
Imbalanced data introduces challenges for churn prediction models as they tend to be biased towards the majority class. This bias can lead to poor performance in detecting the minority class, which in this case, is the churned customers. Understanding the imbalanced data problem is crucial for selecting appropriate techniques to handle it effectively.
Sampling Techniques for Imbalanced Data
Sampling techniques are commonly employed to address imbalanced data. Oversampling the minority class involves creating synthetic samples to increase its representation in the dataset. Techniques such as SMOTE (Synthetic Minority Over-sampling Technique) generate synthetic examples based on the patterns observed in the existing minority class samples. Undersampling the majority class involves reducing its representation in the dataset by randomly selecting a subset of samples. Hybrid approaches that combine oversampling and undersampling strategies can also be employed to create a balanced dataset.
Cost-Sensitive Learning Approaches
Cost-sensitive learning approaches assign different costs to misclassifying the different classes. By assigning a higher cost to misclassifying churned customers, the model is incentivized to prioritize the accurate prediction of the churned class. These approaches help address the imbalance challenge, ensuring that the model focuses on detecting churned customers accurately, even if it means allowing a higher number of false positives.
Ensemble Methods for Imbalanced Data
Ensemble methods are powerful techniques that combine multiple weak classifiers to create a stronger classifier. In the case of imbalanced data, ensemble methods can help address the bias towards the majority class by combining classifiers that focus on different aspects of the problem. Techniques such as bagging, boosting, or stacking can be employed to create ensemble models that achieve better performance in predicting customer churn.
Model Interpretation and Explainability
Interpreting Machine Learning Models
Interpreting machine learning models is crucial in understanding the underlying factors that contribute to churn prediction. Linear models, such as logistic regression or linear support vector machines, provide coefficients that indicate the relative importance of each feature. Decision trees or random forests offer feature importances that highlight the variables influencing the model’s predictions. Interpreting the models helps identify actionable insights and provides explanations for why certain customers are more likely to churn.
Explaining Model Predictions
In addition to interpreting the models globally, it is also important to explain individual predictions. Techniques such as LIME (Local Interpretable Model-Agnostic Explanations) or SHAP (SHapley Additive exPlanations) can provide explanations for specific predictions. These techniques highlight the features that contribute the most to each prediction and help businesses understand the reasoning behind the model’s predictions.
Methods for Model Explainability
Model explainability involves the use of techniques and tools that provide transparency and interpretability to the machine learning models. Methods such as partial dependence plots, permutation importance, or SHAP values can provide insights into how the model is making predictions. By understanding the reasoning behind the model’s predictions, businesses can gain confidence in its decision-making process and address any potential biases or limitations.
Deploying and Monitoring the Churn Prediction Model
Model Deployment in Production
Once the churn prediction model has been trained and evaluated, it is ready to be deployed in a production environment. The deployment process involves integrating the model into the existing business systems or applications, such as CRM systems or customer service platforms. It is essential to ensure that the deployment process is smooth and that the model’s predictions are seamlessly integrated into the existing business workflows.
Monitoring Model Performance
After the churn prediction model has been deployed, it is crucial to continuously monitor its performance. Monitoring involves tracking various performance metrics, such as accuracy, precision, recall, or F1-score, to ensure that the model continues to perform well in real-world scenarios. Regular monitoring enables businesses to identify any drift or degradation in the model’s performance and take corrective actions, such as retraining or updating the model, to maintain its accuracy and usefulness.
Re-Training and Updating the Model
The dynamics of customer churn can change over time due to various internal and external factors. To ensure the model’s effectiveness, it is important to retrain and update the model periodically. By retraining the model with updated data, businesses can capture the changing patterns of churn and improve the accuracy of predictions. Updating the model might also involve incorporating new features or adjusting the model’s parameters based on evolving business requirements.

Case Studies and Success Stories
Real-Life Examples of Using ML for Churn Prediction
Many businesses have successfully utilized machine learning for churn prediction and achieved significant improvements in customer retention. For example, an e-commerce company implemented a churn prediction model using historical customer data and achieved a 20% reduction in customer churn within the first year. A telecommunications company used machine learning algorithms to analyze customer interactions and reduced churn by 15% by proactively addressing customer concerns. These real-life examples demonstrate the effectiveness of machine learning in predicting and preventing customer churn.
Benefits and Impact on Businesses
Implementing a churn prediction model can bring several benefits to businesses. By accurately predicting customer churn, businesses can take proactive measures to retain at-risk customers and prevent revenue loss. This leads to increased customer satisfaction, improved customer loyalty, and higher revenue. Additionally, churn prediction models provide valuable insights into customer behavior and preferences, allowing businesses to tailor their marketing and retention strategies. Overall, the impact of churn prediction on businesses is significant, leading to improved business performance and profitability.
Lessons Learned from Successful Implementations
Successful implementations of churn prediction models have taught businesses several valuable lessons. It is crucial to have access to high-quality, diverse, and reliable data sources to train accurate models. Feature engineering and selection play a critical role in improving prediction accuracy. Regular model monitoring and updating are necessary to maintain performance in dynamic business environments. Additionally, businesses should focus on model interpretability and explainability to gain trust and buy-in from stakeholders. By learning from successful implementations, businesses can optimize their churn prediction efforts and achieve better outcomes.
Challenges and Limitations
Data Quality and Availability
One of the primary challenges in churn prediction is the availability and quality of data. Collecting and consolidating data from various sources can be time-consuming and challenging. Ensuring data consistency and handling missing or erroneous data requires careful attention. Furthermore, maintaining large and diverse datasets poses storage and computational challenges. Overcoming these challenges requires effective data management practices and robust data collection strategies.
Interpretability versus Performance Trade-off
There is often a trade-off between model interpretability and performance in churn prediction. While complex models may achieve higher accuracy, they might lack transparency and interpretability, making it challenging to explain their predictions. On the other hand, simplistic models may sacrifice accuracy in favor of interpretability. Striking the right balance between model complexity and interpretability depends on the business’s specific requirements and priorities.
Outliers and Anomalies
Outliers and anomalies in the data can impact the performance of churn prediction models. Outliers can introduce noise and bias into the model, leading to inaccurate predictions. It is crucial to identify and handle outliers effectively by employing outlier detection techniques or preprocessing methods. Additionally, anomalies in customer behavior can challenge the model’s ability to generalize and predict future churn accurately. Regular monitoring and updating of the model can help address these challenges and ensure optimal performance.
Overfitting and Underfitting Challenges
Overfitting and underfitting are common challenges when training churn prediction models. Overfitting refers to a situation where the model performs well on the training data but fails to generalize to new, unseen data. This can happen when the model is overly complex or when the dataset is small. Underfitting occurs when the model is too simplistic and fails to capture the underlying patterns in the data. Balancing model complexity and generalization capabilities is crucial to avoid overfitting and underfitting and ensure optimal prediction performance.
In conclusion, machine learning has revolutionized the prediction of customer churn. By leveraging relevant data sources, preprocessing techniques, and feature engineering, businesses can build accurate churn prediction models. Choosing the right machine learning algorithm, handling imbalanced data, and interpreting model predictions are critical steps in ensuring the model’s effectiveness. Deploying, monitoring, and updating the model, along with learning from real-life examples, can lead to significant benefits for businesses. Despite challenges and limitations, the use of machine learning for churn prediction offers valuable insights and actionable recommendations for retaining customers and improving business performance.


